Adapted from Turbo Tech 103 by Garrett Turbochargers
Horsepower is all about AIR.
To create a certain amount of horsepower, we MUST have a certain amount of air.
If the amount of air we need for the power we want is more than the engine can hold (such as pumping 10.0L of air into a 5.0L engine), then that air becomes pressurized.
Pressurizing air creates heat, and heat must be avoided. Heat makes the air less dense, which means less oxygen molecules per volume, which means less power.
Heat can also cause pre-ignition (where the air/fuel mixture ignites by itself, before the plug fires), or detonation (where the air/fuel mixture explodes instead of burns), both of which are destructive to the engine.
For maximum performance, a turbocharger must be correctly sized for the application. A correctly sized turbocharger will operate within its efficiency zone, making the most power with the least amount of extra heat.
A turbocharger forced to provide a different volume of air, or a different pressure than it is designed for, will produce extra heat that we don’t want.
Below is a Turbocharger Compressor Map:

All turbos come with Compressor Maps. Things you are looking at:
- Efficiency Islands: you want to be here as much as possible. This is where the turbo is most efficient (minimal extra heat)
- Mass Flow Axis: how much air the turbo can provide
- Pressure Ratio Axis: how much boost it can give you
- Choke Line: if the air you need is past this line, you are choking the engine (the turbo is too small)
- Surge Line: boost instability, “flutter”, potential damage (the turbo is too big, and boost is backing up into the turbo and chopped up by the compressor wheel)
DATA COLLECTION
Things you need to know:
- Horsepower Target (how much do you want?)
- Engine displacement in cubic inches (liters x 61.0237)
- Maximum RPM
- Peak Torque RPM
- Air/Fuel Ratio (we will use 12.0:1, typical for boosted gasoline engines)
- Ambient conditions (air pressure and air temperature)
Things you need to estimate:
- Engine volumetric efficiency at Maximum-RPM (better to estimate low)
- 95-99% for modern 4-valve heads
- 88-95% for 2-valve designs
- 85% for pushrod V8’s
- Engine volumetric efficiency at Peak-Torque-RPM
- Let’s use 98% – an engine’s torque peaks where it is MOST efficient
- Intake Manifold Temperature
- 100-130°F for intercooled
- 175-300°F for non-intercooled
- You really want to run an intercooler.
- Brake Specific Fuel Consumption (BSFC) (The fuel flow rate required for each horsepower)
- Use 0.55 lbs-per-horsepower-hour, typical for gasoline
ESTIMATING AIR FLOW
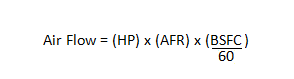
Air Flow is determined using the Horsepower you want, the Air/Fuel Ratio for that power, and the BSFC of your fuel (note: we will be dividing by 60 to convert from hours to minutes).
| Example: 2.0L 4cyl, 400HP | |
|
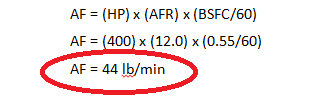 |
| In this example, 400hp requires 44 lbs/min of air. | |
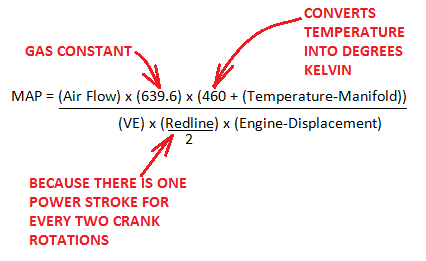
ESTIMATING MANIFOLD PRESSURE
Horsepower is a direct result of air volume. Manifold Pressure is a direct result of air volume being stuffed into a smaller engine volume. We will look at Manifold Absolute Pressure (MAP), which includes existing atmospheric pressure.
| Example: 2.0L 4cyl, 400HP | |
|
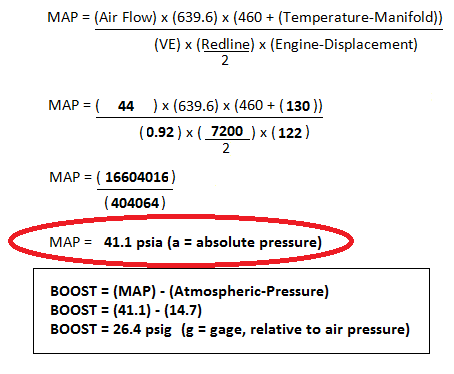 |
| In this example, 44 lbs/min of air stuffed into a 2.0L will result in 41.1psi in the manifold | |
REALITY CHECK 1:
There is some pressure loss from the air traveling through the tubes from the turbo to the cylinder. A well-designed system might lose only 1psi through the tubes, whereas a factory system might lose 4psi or even more. We make up for this loss with more pressure.

| Example: 2.0L 4cyl, 400HP | |
|
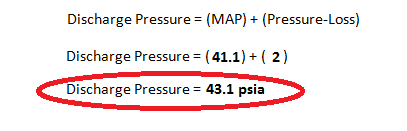 |
| In this example, 41.1 psia making it to the cylinder needs 43.1 psia coming out of the turbo | |
My ’61 Chevy Apache lost 3psi between the compressor outlet and the intake manifold.
I initially had my wastegate referencing the turbo which opened at 5psi, but the engine only saw 2psi.
Now it references the manifold; the turbo now makes 8psi, but now the engine actually sees the 5psi I was after. For the week or two that 5psi was fun.
RULE-OF-THUMB: Every 90° bend costs you 0.5psi
REALITY CHECK 2:
Just like some pressure from the turbo gets lost (consumed) in the intake piping, so too do we lose some of the atmospheric pressure getting into the turbo. Typically we lose 1psi through the air filter and piping to the turbo. We make up for this loss with more pressure.

| Example: 2.0L 4cyl, 400HP | |
|
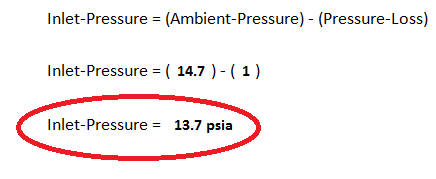 |
| In this example, with an atmospheric pressure of 14.7psi, only 13.7psi makes it to the turbo. | |
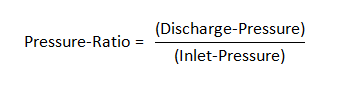
CALCULATING PRESSURE RATIO
Knowing Air-Flow for the horsepower we want, and knowing the MAP we get with the Engine-Displacement, all we need to do is find out the Pressure-Ratio – the last part of the compressor map we need to be able to find.
| Example: 2.0L 4cyl, 400HP | |
|
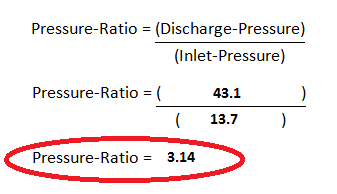 |
| In this example, we are pressurizing the intake 3.14 times that of atmospheric (also called 3.14 BAR, where 1 BAR is 1 Barometric Pressure Unit) | |
We now have enough to plot these operating points on a compressor map. Let’s try a GT28 (the “Disco Potato”) with our example engine:

The required Air-Flow and Pressure-Ratio are totally off the charts. The GT28 is WAY too small for what we want.
Let’s look at a larger GT35:

The required Air-Flow and Pressure-Ratio are past the Surge Line. The GT35 is too big for what we want.
Let’s try a smaller GT30:

This turbo is not bad. Our plot is still within the 72% efficiency island, which isn’t too bad at all. The plot is a good distance from both the Choke Line and the Surge Line, and the lower RPM range of the motor will pass nicely though the meat of the higher efficiency zone and provide excellent performance.
We will also need to plot the Air-Flow needed at the engine’s Peak-Torque.

| Example: 2.0L 4cyl, 400HP | |
|
 |
| In this example, the engine needs 34.1lb/min of Air-Flow at Peak-Torque RPM | |
Let’s run this Air-Flow on the GT30 compressor map:

This shows us how the turbo suits the engine from Peak-Torque to Max-RPM adequately. Running lower than Peak-Torque RPM, there will be less exhaust, the boost pressure will be lower, and the pressure ratio will be lower, which should keep the compressor out of surge.
Honestly, I’d entertain looking at a slightly bigger turbo to get those calculations closer to the center island.
If you were happy enough to run a pressure ratio around 2.0-2.2, this turbo would be awesome. This case is a turbo where you are trying to up the boost, but getting the turbo out of its efficiency zone and it’s creating more heat as a result (less efficient = heat = less potential power = higher detonation risk).
You can tweak a turbo to a certain extent, but at some point you need to move up to a bigger turbo. A bigger turbo will move MORE airflow at a lower PR.
So in a nutshell:
- Air makes power.
- More air stuffed into a motor than it displaces, creates pressure.
- Turbochargers are chosen based on Air-Flow and Pressure-Ratio.
- The right turbo keeps the plot points as close to the center island as you can.
Does that all make sense?